Tutorial – Strategies – Search

The list shows only 5 strategies for each asset. Click REMOVE GROUPING to see all and also filter them.
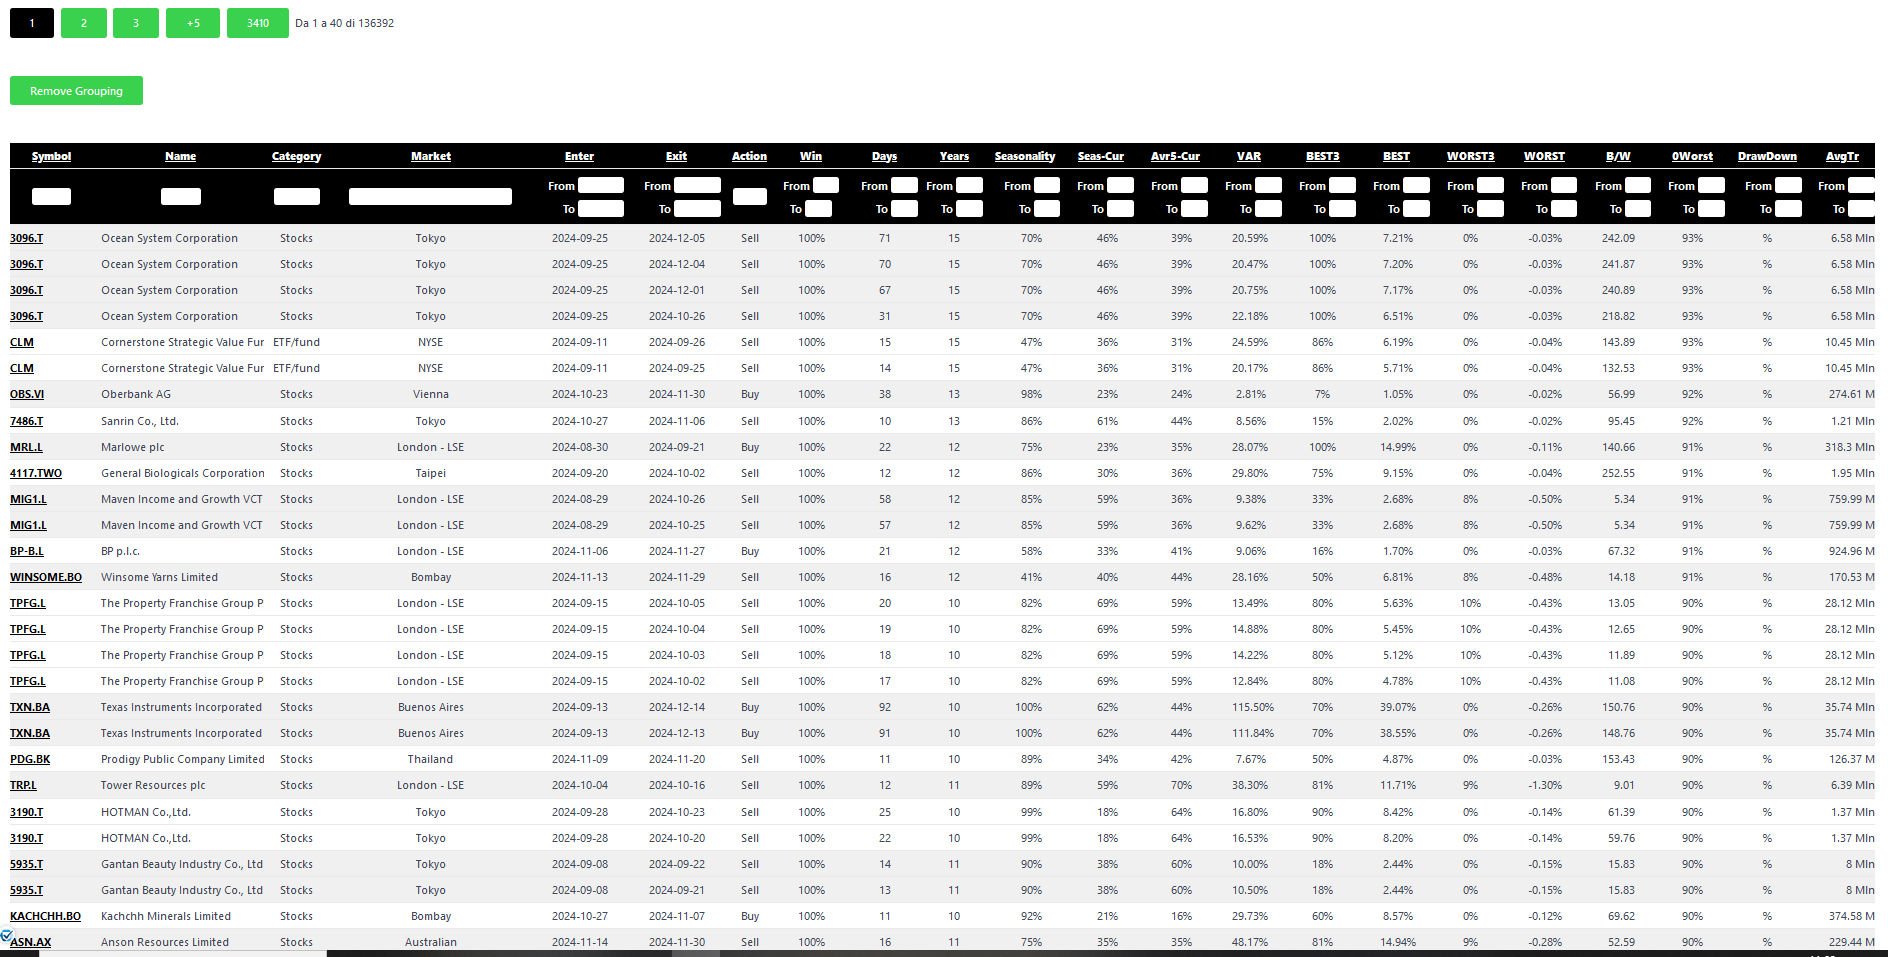
- Symbol: asset symbol or ticker is a unique series of letters assigned to a security for trading purposes
- Name: asset description
- Category: asset type (stock, ETF, Index, etc.)
- Market: Exchange Name
- Enter: start of the seasonal window
- Exit: end of the seasonal window
- Action: Buy/Sell
- Win*: wins in the Years period
- Days: number of days in trade
- Years: years of asset’s strategy history
- Seasonality**: our unique indices to find seasonality by studying a symbol
- Seas-Cur**: relationship between seasonality index and current trend
- Avr5-Cur: relationship between average last 5 years and current trend
- Var: average profit/loss
- Best3: how many years the Best was minimum 3%
- Best: average Best (max high value)
- Worst3: how many years the Worst was minimum 3%
- Worst: average Worst (min low value)
- B/W: reward risk ratio: Best/Worst
- 0Worst*: how many years the Worst was null
- Drawdown: average difference between daily high and low values
- AvgTr: Average Volume * Price
*approximate value, this for the exact days (entry/exit) in the past years trading period. This is correct in the backtest of the strategy.
**value calculable only with at least 8 years of history.